
As a data visualization tool, histograms have become increasingly popular in various fields, including statistics, data analysis, and science. However, many people are still unsure about the meaning and purpose of histograms. In this article, we will delve into the world of histograms, exploring their significance, types, and applications.
What is a Histogram?
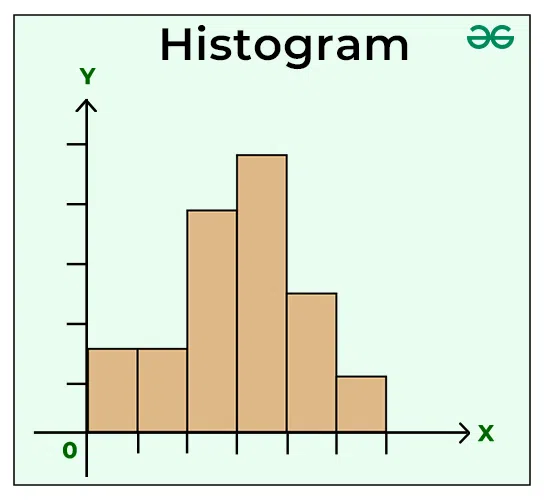
A histogram is a graphical representation of a distribution of data, typically displayed as a series of bars or rectangles. Each bar represents a class interval on the x-axis, while the height of each bar corresponds to the frequency or density of data points within that interval.
Histograms are often used in statistics to visualize and analyze the distribution of continuous variables. By creating a histogram, we can gain insights into the shape and structure of our data, which can be crucial for making informed decisions.
Histograms in Statistics
Histograms are commonly used in statistics to summarize and visualize data distributions. They help identify patterns and trends in data, allowing analysts to better understand the characteristics of the data set.
There are several types of histograms that cater to different statistical applications:
- Discrete histograms: Used for categorical data with distinct classes.
- Continuous histograms: Used for numerical data with a range of values.
- Histograms for binary data: Used for analyzing binary variables, such as success/failure or presence/absence.
Types of Histograms
There are several types of histograms that can be used to suit specific statistical needs:
- Ortogrammas: A type of histogram that displays data as bars or rectangles aligned along an axis, often used for categorical data.
- Bar charts with height proportional to frequency: A type of histogram where the height of each bar is proportional to the frequency of data points.
Applications of Histograms
Histograms have numerous applications in various fields, including:
- Data analysis and visualization: Histograms help identify patterns and trends in data.
- Statistics and research: Histograms are used to summarize and visualize data distributions.
- Business and finance: Histograms can be used to analyze customer behavior and market trends.
Educational Use of Histograms
Histograms can be an effective teaching tool, helping students understand the concept of data distribution. In elementary school, histograms can be used as a game-like activity to introduce students to basic statistical concepts.
Differences Between Histograms and Orthograms
While both histograms and orthograms display data as bars or rectangles, there are key differences between them:
- Orientation: Histograms are typically displayed vertically, while orthograms are displayed horizontally.
- Data representation: In histograms, the x-axis represents class intervals, while in orthograms, the y-axis represents categories.
Examples of Histograms
Histograms have numerous real-world applications, such as:
- Fotografie digitale e fotoritocco: Histograms can be used to analyze image luminosity.
- Customer behavior analysis: Histograms help businesses understand customer purchasing patterns.
Interpreting Histograms
When interpreting histograms, it’s essential to consider the following factors:
- Shape and structure of the histogram: The shape and structure of the histogram can indicate whether the data follows a specific distribution or pattern.
- Mean and standard deviation: The mean and standard deviation of the data can help identify the central tendency and variability of the data set.
- Maximum and minimum values: The maximum and minimum values of the data can provide insights into the range of the data.
Creating Histograms
To create a histogram, you need to follow these steps:
- Identify the class intervals: Determine the number of classes for your variable.
- Gather frequency data: Collect the frequency data for each class interval.
- Create bins: Create bins or rectangles that represent each class interval.
- Plot the histogram: Plot the histogram using a graphing tool or software.
Frequently Asked Questions (FAQs)
Q: What is the purpose of a histogram?
A: A histogram is used to visualize and analyze the distribution of continuous variables.
Q: How do I create a histogram?
A: To create a histogram, you need to identify the class intervals and frequency data for your variable.
Q: Can histograms be used for categorical data?
A: Yes, but it’s recommended to use an orthogram instead.
Q: What is the difference between a histogram and an orthogram?
A: The main difference lies in their orientation and how they represent data categories.
Q: How do I interpret a histogram?
A: A histogram can help you understand patterns and trends in your data, but it’s essential to consider the context and limitations of the visualization.
Best Practices for Histograms
Here are some best practices to keep in mind when working with histograms:
- Choose the right number of classes: Choose a number of classes that is sufficient to capture the distribution of the data.
- Use meaningful class labels: Use clear and concise class labels that accurately represent the categories or bins.
- Consider the scale: Consider the scale of the x-axis when choosing class intervals, as large gaps may not be suitable for all types of data.
Common Mistakes to Avoid When Creating Histograms
When creating histograms, there are several common mistakes to avoid:
- Insufficient classes: Using too few classes can lead to inaccurate conclusions about the distribution of the data.
- Inadequate class labels: Poorly labeled classes can make it difficult to interpret the histogram.
- Incorrect bin size: Choosing a bin size that is too large or too small can distort the shape and structure of the histogram.
Conclusion
In conclusion, histograms are a powerful tool for data visualization and analysis. By understanding the concept of histograms, you can unlock new insights into your data sets. Whether you’re a statistics enthusiast or just starting to explore data analysis, histograms will become an essential tool in your toolkit.
By following these guidelines and best practices, you can create effective histograms that provide valuable insights into your data sets.


