
Have you ever stopped to think about what happens when a substance changes from one state to another? Perhaps you’ve noticed how water behaves when it freezes or melts, but have you ever wondered what drives these transformations?
In this article, we’ll delve into the world of curves of freezing and melting, exploring the fascinating science behind state changes. We’ll discover how these curves reveal important information about materials, their properties, and the behavior of substances at different temperatures.
What are Curves of Freezing and Melting?
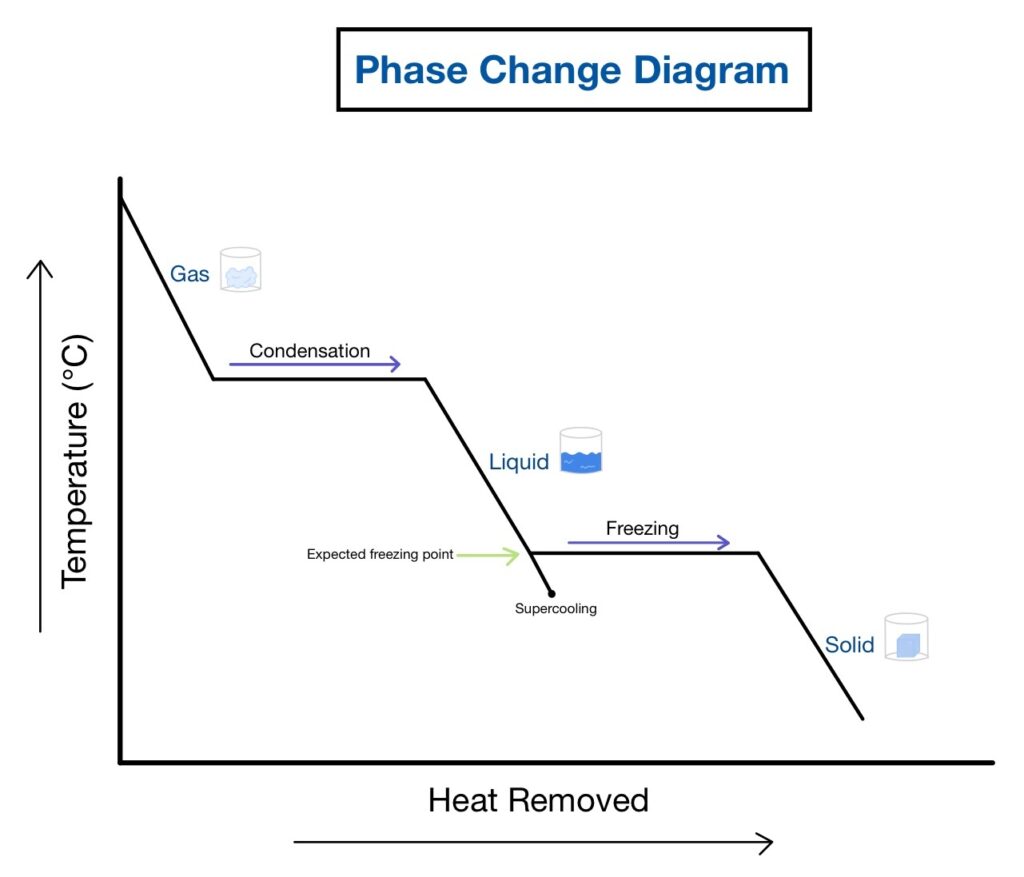
A curve of freezing or melting is a graphical representation of the relationship between temperature and time during a phase transition. This transition occurs when a substance changes from one state to another, such as from solid to liquid (melting) or from liquid to gas (vaporization).
These curves are essential tools for understanding the properties of materials, particularly their thermal behavior. By analyzing these curves, scientists can gain insights into the material’s structure, composition, and physical properties.
The Curve of Freezing: Water as a Case Study
Let’s take water as an example to illustrate how curves of freezing work. When we heat water, it eventually reaches its boiling point (100°C at sea level) and turns into steam. However, when we cool down the water, it will eventually freeze into ice.
To visualize this process, imagine drawing a curve on a graph paper with temperature on the y-axis and time on the x-axis. As you lower the temperature, the curve of freezing shows how the substance (in this case, water) changes from liquid to solid.
The Curve of Freezing: Key Points
When analyzing the curve of freezing for water:
- Initial Temperature: At temperatures above 0°C, water remains in a liquid state.
- Freezing Point: When the temperature reaches 0°C, the water begins to freeze into ice.
- Latent Heat: As the water freezes, it absorbs latent heat energy from its surroundings, causing the temperature to remain constant (32°F or 0°C).
Curves of Freezing and Melting: Comparison
While the curve of freezing focuses on the transition from liquid to solid, the curve of melting represents the opposite process – the transition from solid to liquid. These curves are essential for understanding a substance’s behavior during phase transitions.
Types of Phase Transitions
Phase transitions can occur at constant pressure (solid-liquid and gas-liquid) or at constant temperature (solid-solid and liquid-liquid). The curve of freezing typically illustrates the latter, where the phase transition occurs at a fixed temperature.
Applications of Curves of Freezing and Melting
These curves have numerous practical applications:
- Materials Science: Understanding how materials change state with temperature helps researchers design new materials with specific properties.
- Food Processing: By analyzing the curve of freezing for food, manufacturers can optimize processing conditions to preserve nutritional value and texture.
- Environmental Engineering: Studying phase transitions in soil and water helps engineers develop more efficient systems for wastewater treatment and climate change mitigation.
The Science Behind State Changes
State changes occur when a substance is subjected to certain conditions, such as temperature or pressure. The process of state change involves the breaking and forming of chemical bonds between atoms or molecules, which can result in changes to the substance’s structure and properties.
Factors Affecting Phase Transitions
Several factors can influence phase transitions:
- Temperature: Changes in temperature can affect a substance’s ability to undergo a phase transition.
- Pressure: Pressure can impact the ease with which a substance can change state, particularly at high pressures.
- Composition: The presence of impurities or additives can alter a substance’s phase transition behavior.
- Surface Area: The surface area of a substance can affect its ability to undergo a phase transition.
Conclusion
Curves of freezing and melting are essential tools for understanding the science behind state changes. By analyzing these curves, scientists can gain insights into the properties of materials, their behavior at different temperatures, and the processes that govern phase transitions.
Whether you’re a scientist, engineer, or simply curious about the world around you, exploring the fascinating realm of curves of freezing and melting can deepen your understanding of the natural world.
Frequently Asked Questions
- What is the difference between the curve of freezing and the curve of melting?
The curve of freezing represents the transition from solid to liquid, while the curve of melting represents the opposite process – the transition from liquid to solid. - Why are curves of freezing and melting important in materials science?
These curves help researchers design new materials with specific properties by understanding how substances change state with temperature. -
Can curves of freezing and melting be used for predicting weather patterns?
No, these curves are not directly applicable to predicting weather patterns. However, they can provide insights into the thermal behavior of materials, which is essential for climate modeling and weather forecasting. -
What is latent heat energy, and why is it important in phase transitions?
Latent heat energy is the energy required to change a substance’s state without changing its temperature (e.g., ice melting). This energy plays a crucial role during phase transitions. -
Can curves of freezing and melting be used for predicting food spoilage?
Yes, these curves can help manufacturers optimize processing conditions to preserve nutritional value and texture in food products. -
How do curves of freezing and melting relate to environmental engineering?
Studying phase transitions in soil and water helps engineers develop more efficient systems for wastewater treatment and climate change mitigation. -
Can curves of freezing and melting be used for predicting the behavior of materials under extreme temperatures?
Yes, these curves can provide insights into a substance’s thermal behavior at different temperatures, which is essential for designing materials that can withstand extreme conditions. -
Are there any limitations to using curves of freezing and melting in scientific research?
While these curves are powerful tools for understanding phase transitions, they have limitations when applied to complex systems or materials with unusual properties.
In Conclusion
Curves of freezing and melting are an essential tool for understanding the science behind state changes. By analyzing these curves, scientists can gain insights into the behavior of substances at different temperatures, which is crucial for designing new materials, optimizing food processing conditions, and developing more efficient environmental engineering systems.


