
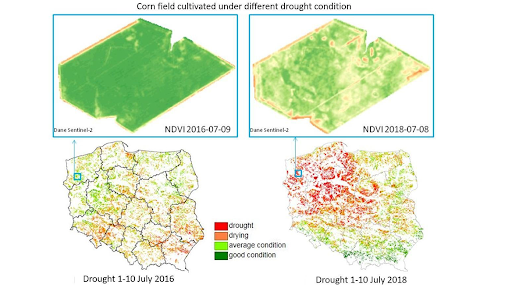
Vegetation indices are a crucial tool for monitoring and understanding the health and productivity of vegetation. In this article, we will delve into the world of vegetation indices, exploring their history, principles, and applications.
What are Vegetation Indices?
Vegetation indices are mathematical formulas that convert reflectance data from remote sensing instruments (such as satellite or drone sensors) into a numerical value that represents the amount of vegetation present. These indices are derived from the spectral signatures of vegetation, which are unique patterns of reflectance across different wavelengths of light.
Types of Vegetation Indices
There are three main types of vegetation indices:
- Indices Intrinsic (or Slope-based): These indices combine reflected signals in specific bands to create a ratio that correlates with biomass, health status, and productivity.
- Indices of Distance: These indices use the spectral signature of soil as a reference point to minimize the contribution of reflection by underlying vegetation cover.
- Indices with Atmospheric Corrections: These indices attempt to minimize atmospheric effects on spectral measurements.
Radar Vegetation Indices
Radar data are highly sensitive to geometric properties and moisture content of surfaces. In particular, characteristics derived from signal amplitude allow for vegetation characterization. Synthetic Aperture RADAR (SAR) sensors use varying wavelengths between 0.6 and 140 cm; the same sensor emits and records electromagnetic energy reflected from illuminated surfaces.
Common radar vegetation indices include:
- Radar Vegetation Index – RVI
- Cross-Ratio – CR
- Normalized Ratio Procedure between Bands – NRPB
Optical Vegetation Indices
Spectral behavior describes the reflective behavior of surfaces with respect to various wavelengths of electromagnetic radiation. Remote sensing measures and interprets spectral signatures (typically in the range of 350-2500 nm) to derive information about the properties of bodies that express them.
Common optical vegetation indices include:
- Ratio Vegetation Index – RVI
- Normalized Difference Vegetation Index – NDVI
- Perpendicular Vegetation index – PVI
- Soil-adjusted Vegetation Index – SAVI
NDVI: A Direct Measure
The Normalized Difference Vegetation Index (NDVI) is a direct measure constructed mathematically from data recorded by multispectral sensors on satellites, aircraft, drones, or proximal fields. NDVI values range between -1 and 1, indicating the presence of vegetation.
Values between 0.4 and 1.0 indicate increasing vegetation density or activity, while values within 0-0.4 denote the absence of vegetation, identifying bare soils or anthropic surfaces.
Applications of Vegetation Indices
Vegetation indices have numerous applications in various fields, including:
- Agriculture: Monitoring crop health, productivity, and moisture content
- Climate Change: Studying the impact of climate change on vegetation patterns
- Wildfire Management: Identifying areas at high risk of wildfires
Advantages of Vegetation Indices
Vegetation indices offer several advantages over traditional field measurements:
- Cost-effectiveness: Remote sensing technology is relatively inexpensive compared to in-field observations.
- Scalability: Vegetation indices can cover large areas, making them ideal for monitoring changes across vast landscapes.
- Time-saving: Remote sensing allows for rapid acquisition of data, reducing the time required for monitoring and analysis.
Challenges and Limitations
While vegetation indices are powerful tools, they also have limitations:
- Atmospheric Interference: Atmospheric conditions can affect spectral measurements, leading to inaccuracies in vegetation index calculations.
- Sensor Calibration: Proper sensor calibration is essential to ensure accurate data collection and processing.
- Data Interpretation: Vegetation indices require expert interpretation to accurately understand the results.
Conclusion
Vegetation indices are a valuable tool for understanding and monitoring vegetation. By using these indices, we can gain insights into the health, productivity, and moisture content of vegetation, ultimately informing decision-making in various fields.
Frequently Asked Questions (FAQs)
- What is the difference between radar and optical vegetation indices?
Radar vegetation indices are based on radar data, while optical vegetation indices are based on spectral signatures. - How do NDVI values range from -1 to 1?
NDVI values range from -1 to 1 because they represent a ratio of reflectance in the infrared near-band (NIR) and red-band (RED). - Can NDVI be used for crop monitoring?
Yes, NDVI can be used for crop monitoring, as it provides information about crop health, productivity, and moisture content. - How do vegetation indices account for atmospheric effects?
Vegetation indices with atmospheric corrections attempt to minimize atmospheric effects on spectral measurements. -
Can radar vegetation indices be used for crop monitoring?
No, radar vegetation indices are not suitable for crop monitoring, as they require clear lines of sight and can be affected by moisture content and geometric properties of surfaces. -
How do indices of distance work?
Indices of distance use the spectral signature of soil as a reference point to minimize the contribution of reflection by underlying vegetation cover. - Can optical vegetation indices be used for wildfire management?
Yes, optical vegetation indices can be used for wildfire management, as they provide information about vegetation health and moisture content. - How do vegetation indices relate to climate change?
Vegetation indices can help study the impact of climate change on vegetation patterns, as changes in vegetation indices can indicate shifts in climate conditions.
Future Directions
The development of new vegetation indices will continue to advance our understanding of vegetation properties and its response to environmental changes. Future research directions include:
- Integration with Machine Learning Algorithms: Developing machine learning algorithms that can integrate with vegetation indices to improve accuracy and efficiency.
- Integration with Other Remote Sensing Data: Combining vegetation indices with other remote sensing data, such as soil moisture or temperature sensors, to create a comprehensive understanding of ecosystem health.
- Improved Atmospheric Correction Methods: Developing more accurate atmospheric correction methods to minimize errors in spectral measurements.
Conclusion
Vegetation indices are a powerful tool for monitoring and understanding the health and productivity of vegetation. By continuing to advance our knowledge of these indices and their applications, we can gain valuable insights into the complex interactions between vegetation and its environment.


